
Trading Indicators on ConcoDeFi: Simple Indicators, Hybrid Score and ETH/BTC Pairs Trading
ConcoDeFi provides several proprietary trading indicators designed to help you understand the crypto market at different levels of complexity, from beginner-friendly dashboards to advanced tools for experienced traders.
This article explains what each indicator does, how it works, which data it uses and when it makes sense to use each one.
🎯 1. Simple Trading Indicators
Description
The Simple Trading Indicators are a basic real-time market analysis dashboard designed for beginners and users who want a clear market overview without technical complexity.
The goal is to provide an easy-to-read snapshot of the overall market and major assets.
What does it do?
It displays real-time market data across four main sections:
- Main prices: BTC and ETH price, 24h change, volume and market cap.
- Sentiment indicators: Fear & Greed Index, Bitcoin dominance and total market capitalization.
- Basic technical indicators: Simplified RSI for BTC and ETH showing overbought and oversold zones.
- Market trend: Simple trend classification (bullish, bearish or neutral).
Data sources
- Real-time price data from Binance, CoinGecko and CryptoCompare.
- Fear & Greed Index from Alternative.me.
- Global market metrics.
- Simplified RSI based on 24h price changes.
- Short-term momentum analysis.
Key features
- 100% free access (registration required).
- Auto-refresh every 60 seconds.
- API fallback system for reliability.
- Clean and intuitive interface.
- No technical complexity.
- Real-time market data.
Access level
MEMBER (Free)
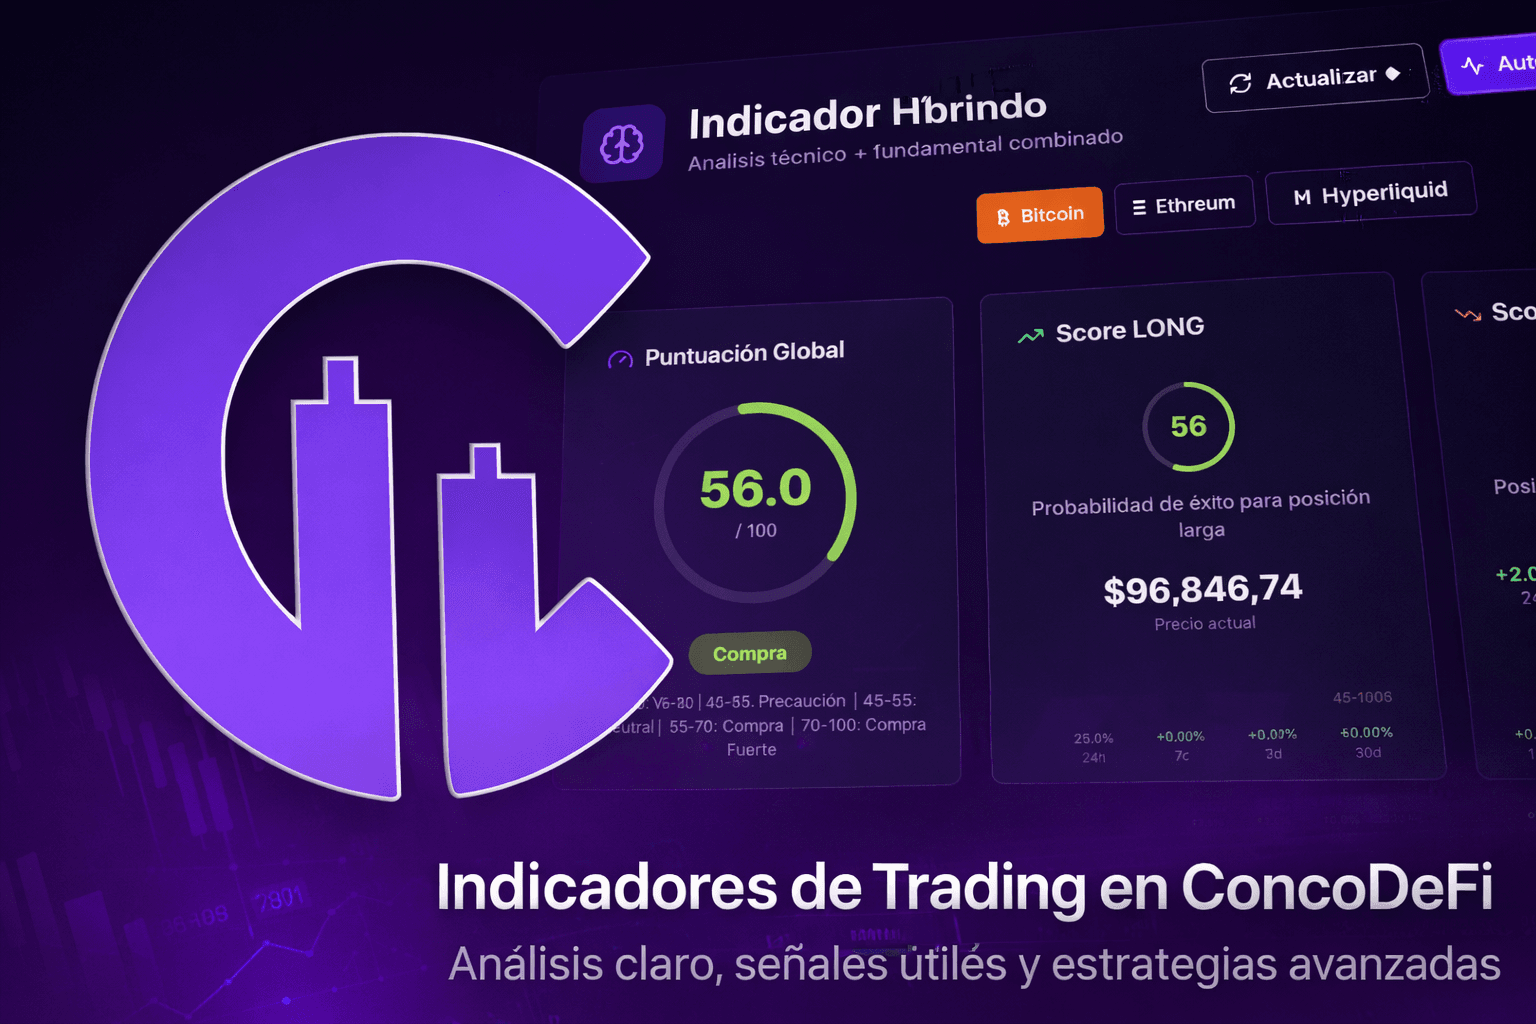
🧠 2. Hybrid Score Indicator
Description
Hybrid Score is an advanced indicator that combines technical and fundamental analysis into a single 0–100 score representing the relative strength of buy or sell conditions.
It is designed for traders who want a structured and comprehensive decision-support tool.
What does it do?
It calculates a global score (0–100) for BTC, ETH and HYPE:
- 0 – 30: Strong Sell
- 30 – 45: Sell
- 45 – 55: Neutral
- 55 – 70: Buy
- 70 – 100: Strong Buy
Score composition
- 60% Technical Analysis
- 40% Fundamental Analysis
Technical indicators used
- RSI (14)
- MACD
- Moving averages: SMA20, SMA50, SMA200, EMA12 and EMA26
- Golden Cross and Death Cross
- Bollinger Bands
- ATR (volatility)
- Price momentum
Fundamental indicators used
- Fear & Greed Index
- 24h trading volume
- Market cap and dominance
- Price changes (24h, 7d, 30d)
- Funding rates
- Open interest
- Institutional flow proxies
- On-chain activity
Scoring modules (11 modules)
Each module contributes a specific weight:
- RSI (15%)
- MACD (15%)
- Moving averages (20%)
- Bollinger Bands (10%)
- Fear & Greed Index (15%)
- Price trend (15%)
- Momentum (8%)
- Funding rate (12%)
- Institutional flows (12%)
- On-chain activity (8%)
- Market interest and searches (8%)
Weights are internally normalized for the final score.
Key features
- Clear 0–100 score.
- Combined technical and fundamental analysis.
- 11 specialized modules.
- Historical score charts (24h, 7d, 30d).
- Real-time updates.
- Supports BTC, ETH and HYPE.
- Detailed breakdown of components.
Access level
VIP-2
⚖️ 3. ETH/BTC Pairs Trading Indicator
Description
The ETH/BTC Pairs Trading indicator is designed for traders who operate the relative performance between Ethereum and Bitcoin.
It identifies opportunities to go LONG ETH / SHORT BTC or the opposite.
What does it do?
It calculates a 0–100 score based on the ETH/BTC ratio:
- < 35: LONG BTC / SHORT ETH
- 35 – 47: Neutral-bearish zone
- 47 – 53: Neutral (no trade)
- 53 – 65: Neutral-bullish zone
- > 65: LONG ETH / SHORT BTC
Indicators used
- ETH/BTC ratio price.
- RSI of the ratio.
- MACD of the ratio.
- Moving averages: SMA20, SMA50 and SMA200.
- EMA 12 and EMA 26.
- Bollinger Bands.
- ATR volatility.
- Candle confirmation.
Analysis modules (5 modules)
-
Trend (35%)
Primary direction and moving average alignment. -
Momentum (25%)
Strength of the move using RSI and MACD. -
Mean Reversion (20%)
Detection of extreme deviations from the mean. -
Volatility (10%)
Risk context based on ATR and band expansion. -
Confirmation (10%)
Signal validation through candle confirmation and indicator alignment.
Confirmation system
- Minimum of 3 consecutive candles.
- Alignment of RSI, MACD and moving averages.
- Strong signals only when confirmation is complete.
Access level
VIP-2
🎯 Which indicator should you use?
- Simple Indicators: best for beginners and general market tracking.
- Hybrid Score: for in-depth analysis and trading decisions.
- ETH/BTC Pairs Trading: for relative value and market-neutral strategies.
⚠️ Disclaimer
These indicators are provided for informational purposes only and do not constitute investment advice.
Always perform your own analysis and act responsibly.
This content should not be considered financial advice.
Related Links
Support This Article
Help us create more quality content like this